Repositories overview
When you navigate to/<your-org>/flaky-tests, you land on a repositories overview showing all monitored repositories at a glance.
Each repository row displays:
| Column | Description |
|---|---|
| Tests | Total tracked test cases in the repository (60-day window) |
| Flaky | Number of currently flaky test cases, with a 10-day trend sparkline |
| Broken | Number of currently broken test cases, with a 10-day trend sparkline |
| Runs / Day | Bar chart of test run volume over the last 10 days, with per-day tooltips |
| Icon | Meaning |
|---|---|
| Shield | Quarantining is enabled for this repository — auto-quarantine is off |
| Shield with checkmark | Auto-quarantine is enabled — flaky tests are quarantined automatically |
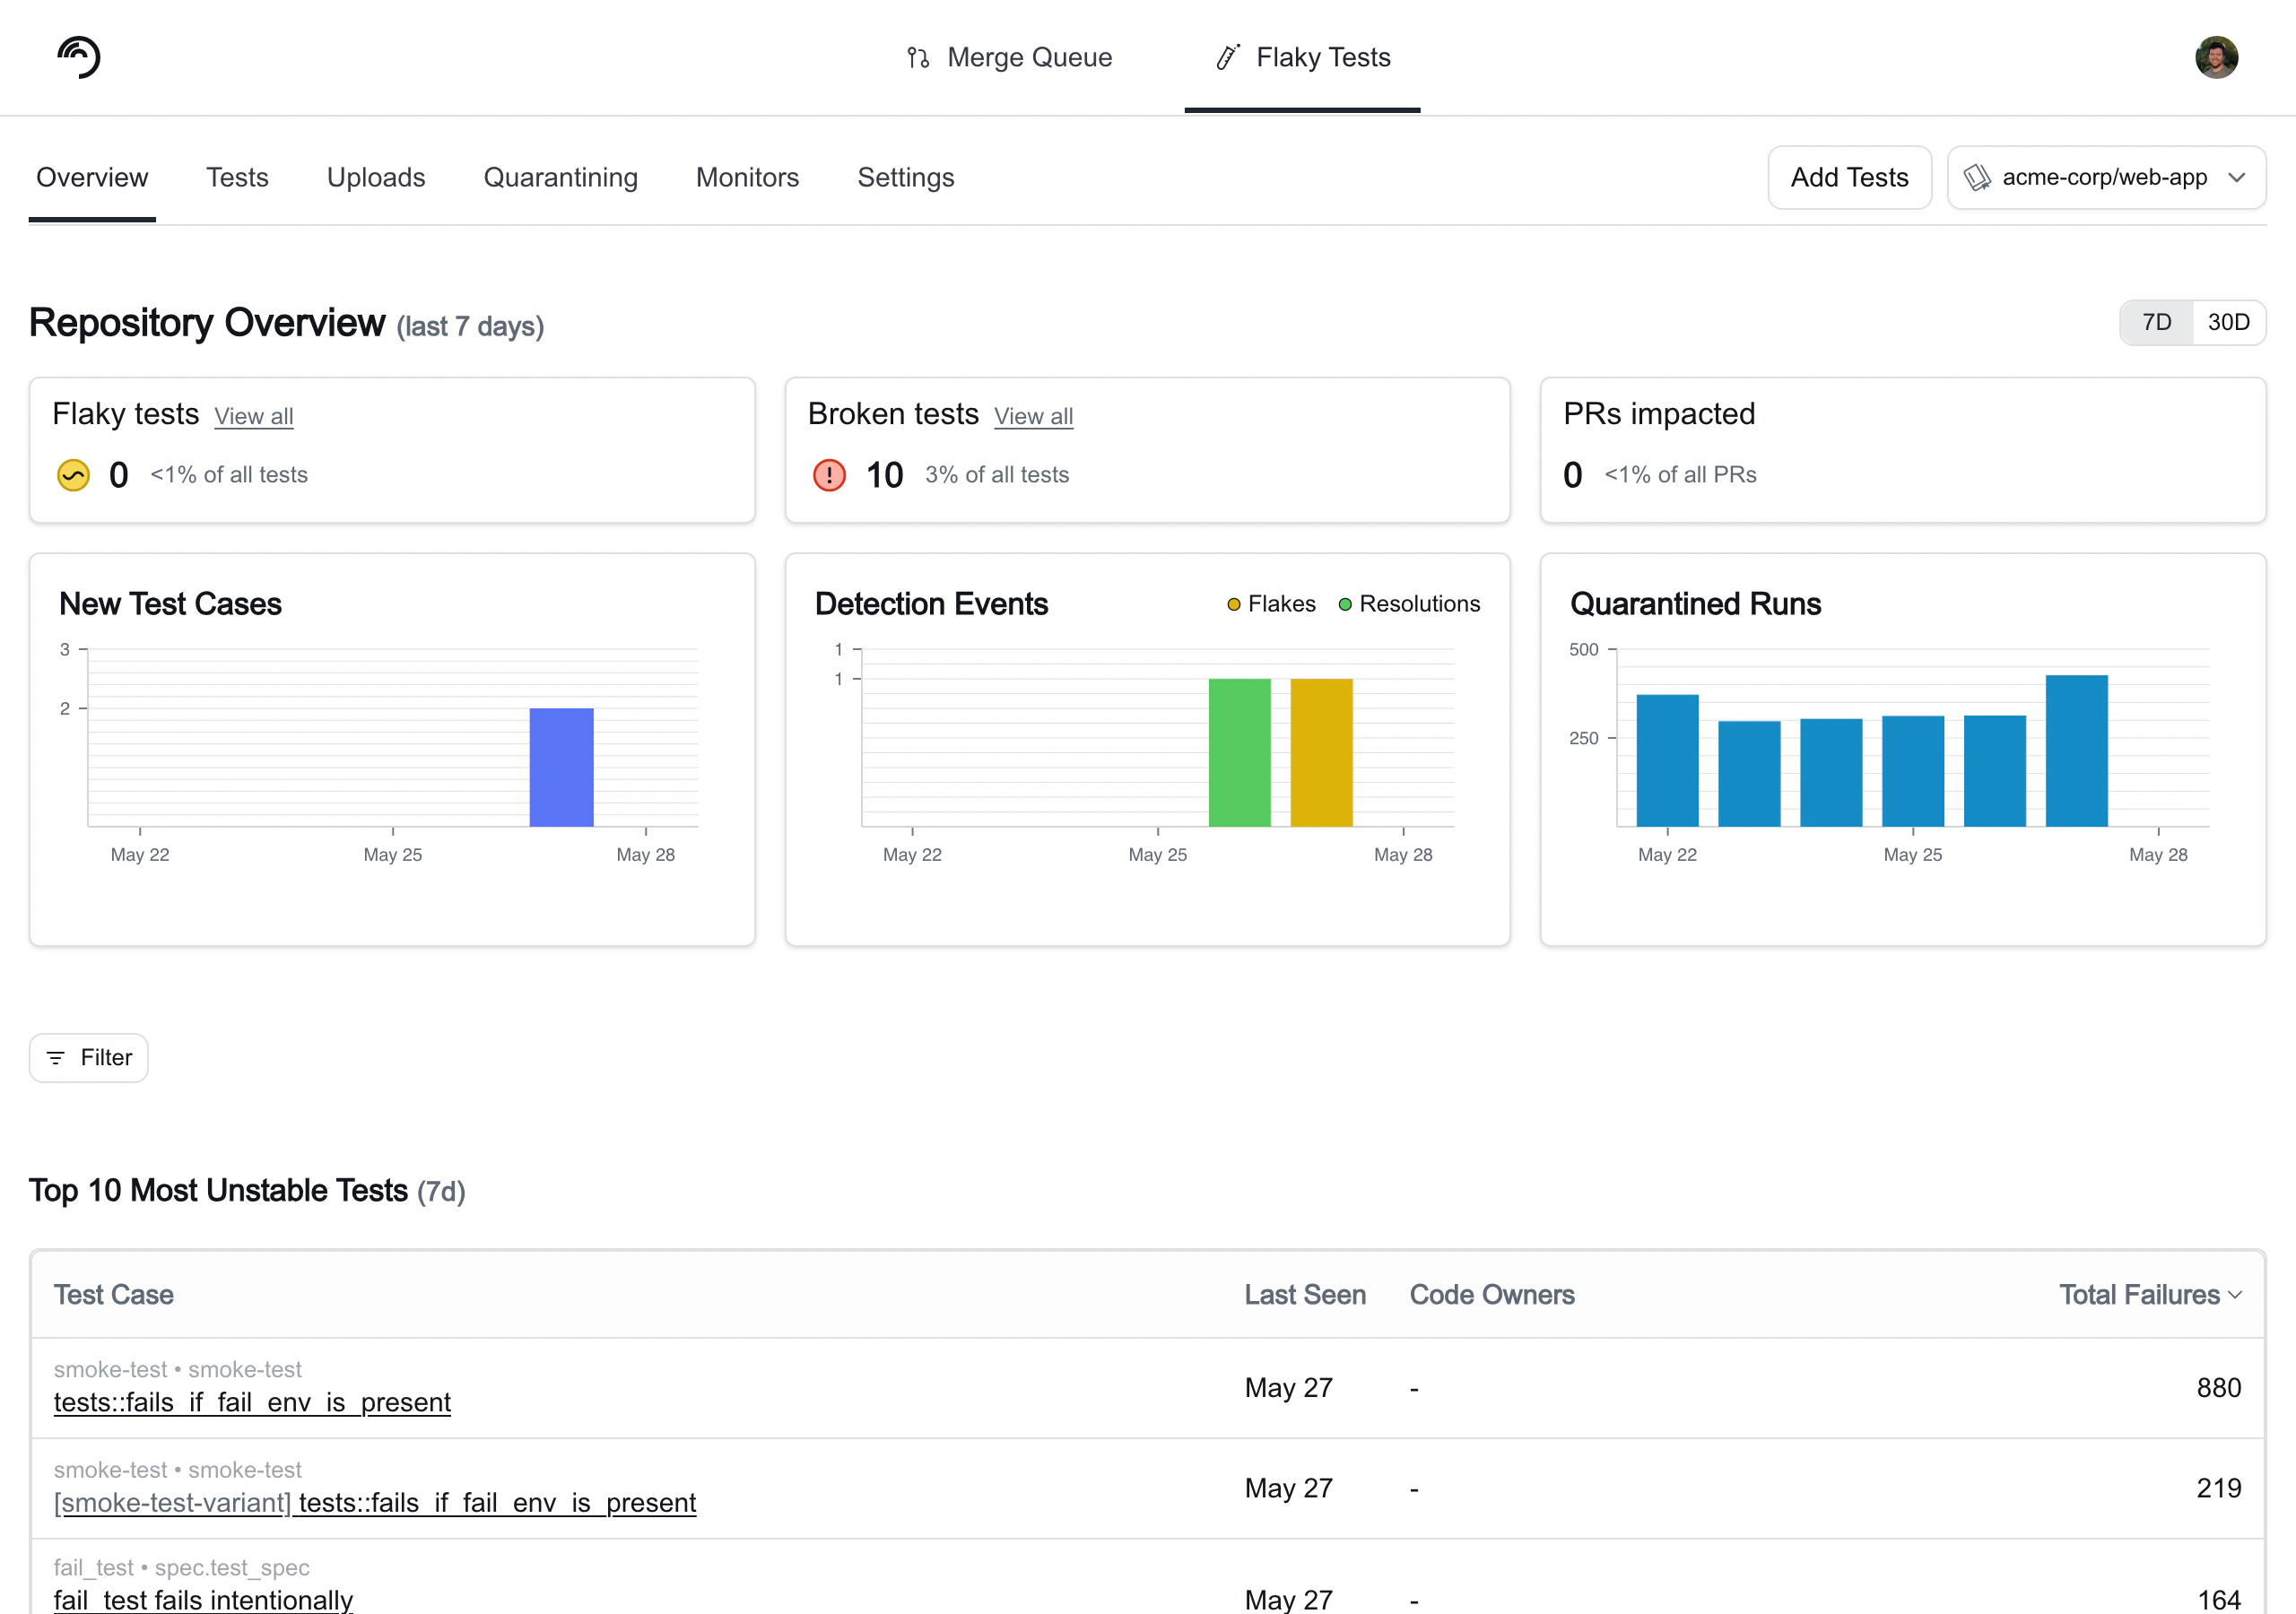
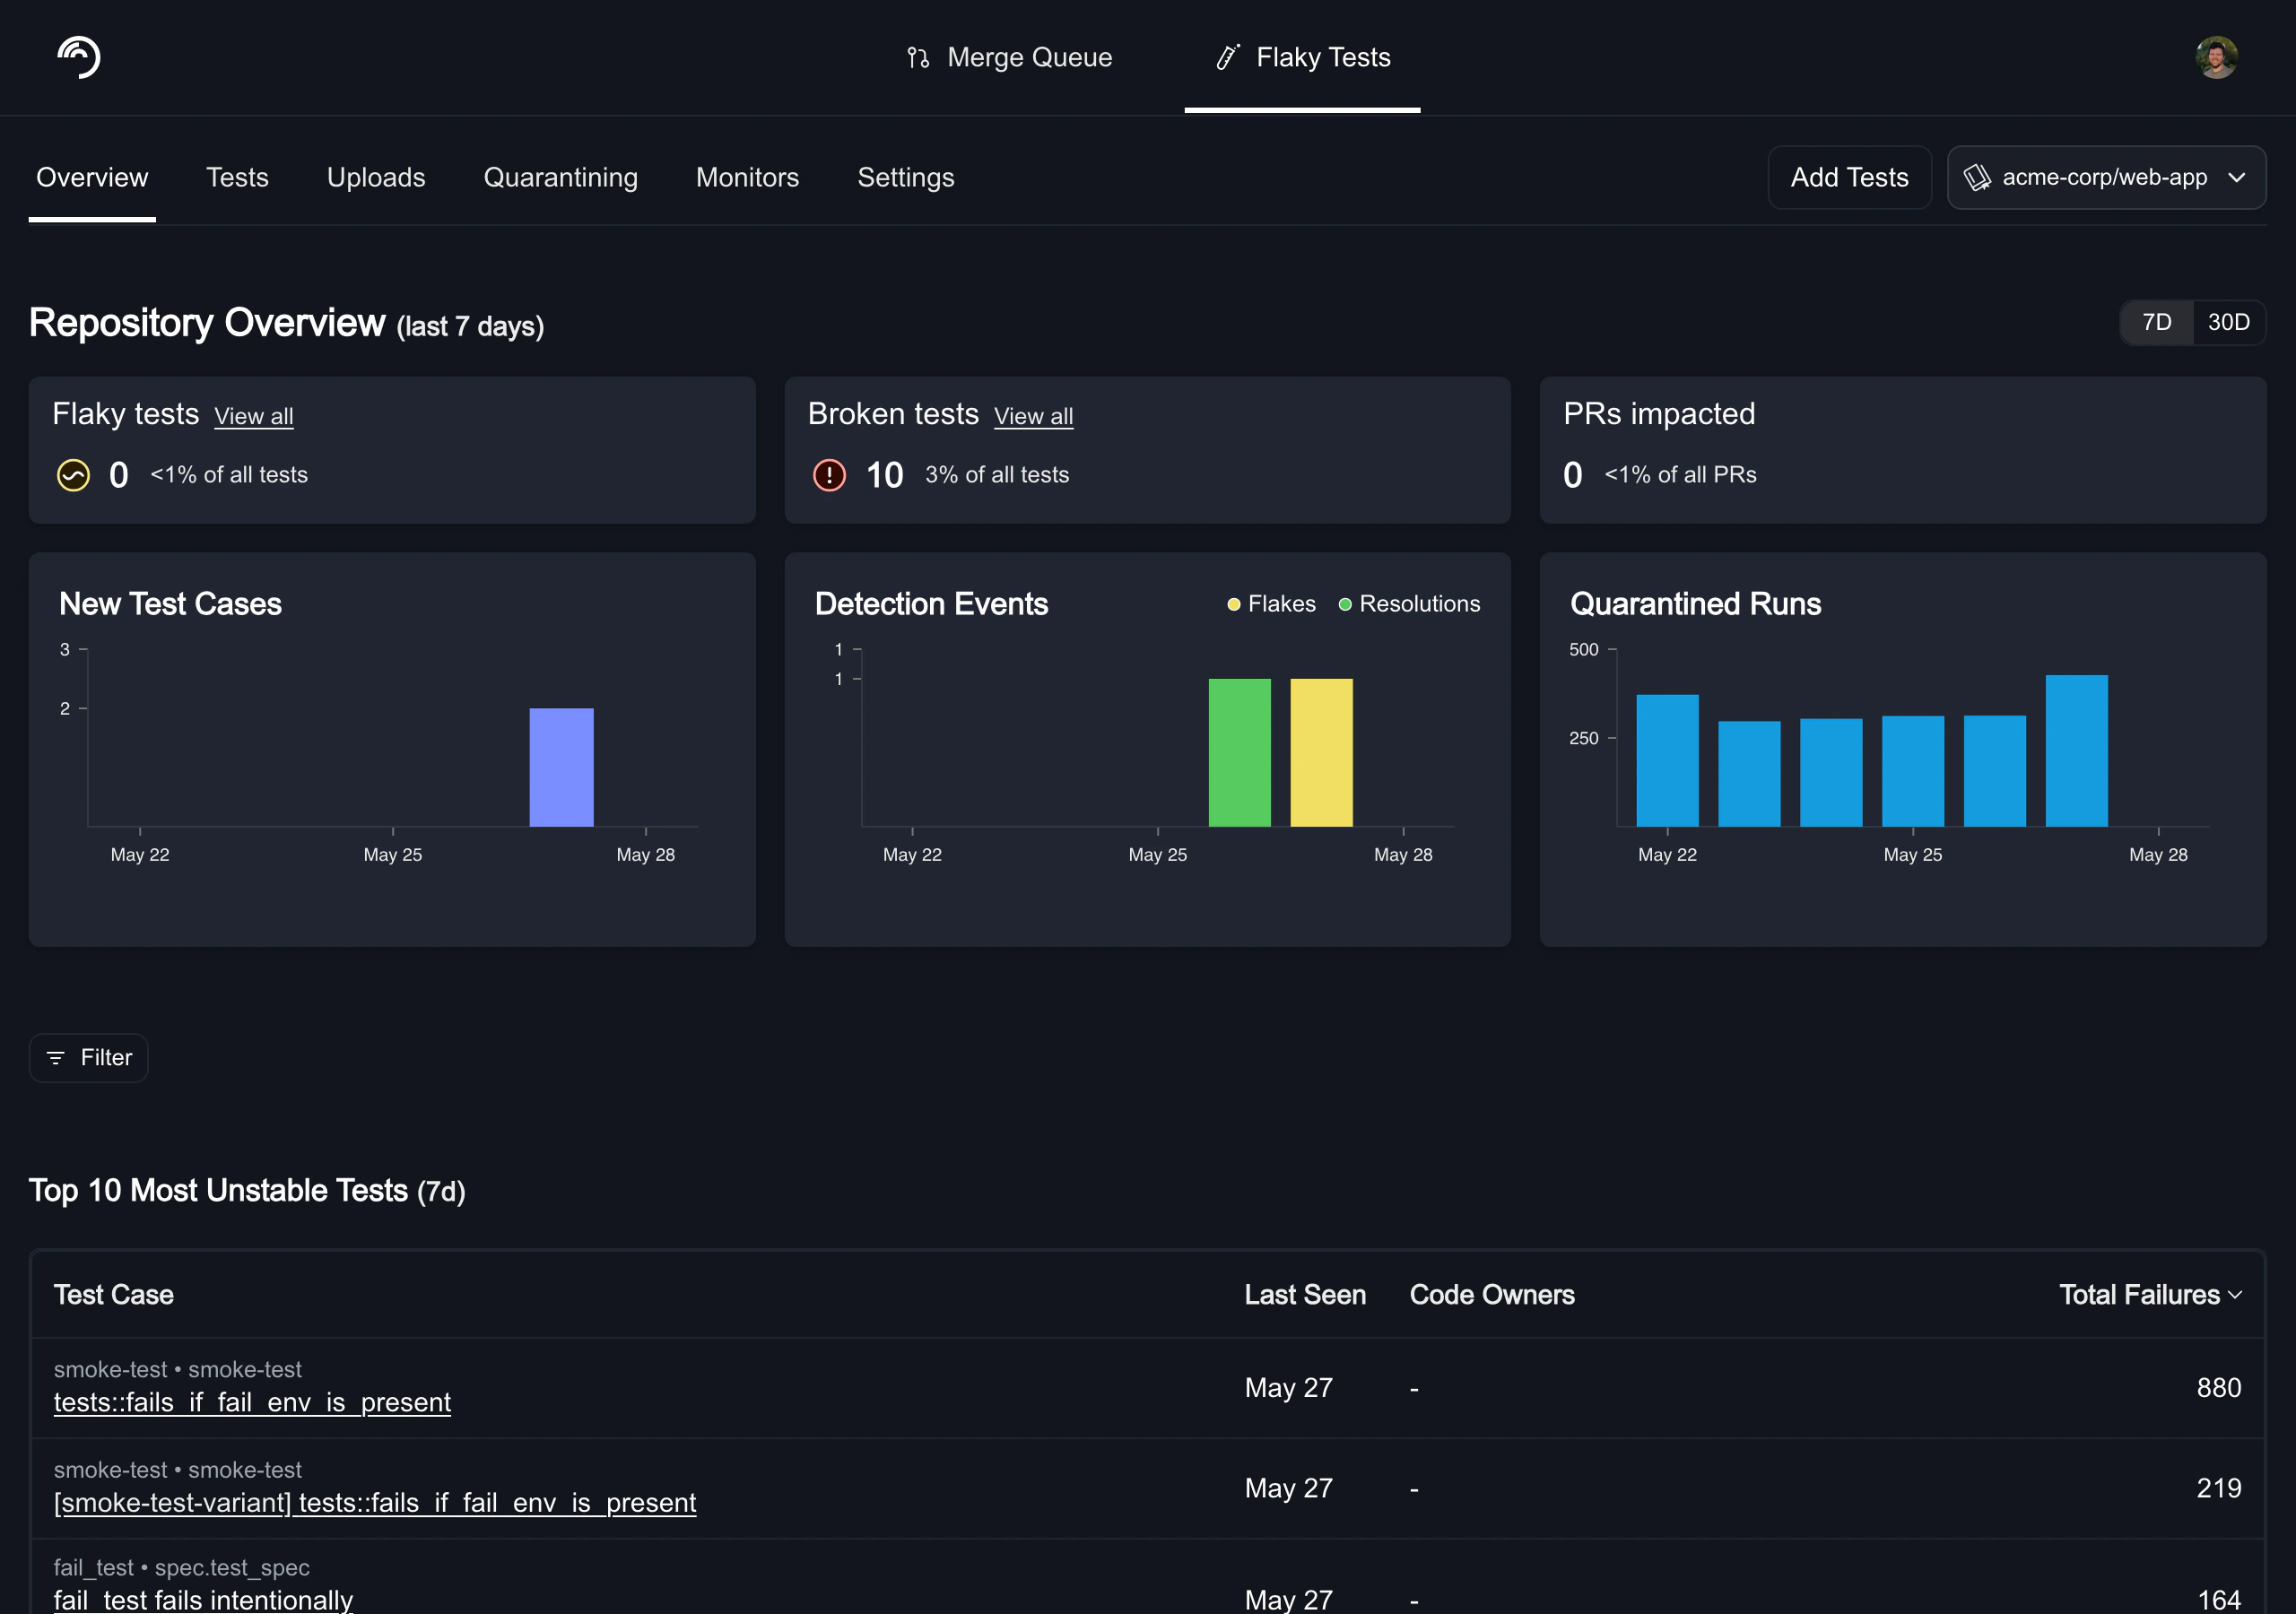
Key repository metrics


| Metric | Description |
|---|---|
| Flaky tests | Number of flaky test cases in your repo. |
| PRs blocked by failed tests | PRs that have been blocked by failed tests in CI. |
Tests cases overview
| Column | Description |
|---|---|
| Tests | The variant, file path, and name of the test case. |
| Status | The health status of the test case: Healthy, Flaky, or Broken. Broken indicates consistent high-rate failures; Flaky indicates intermittent failures. |
| Failure Rate | The percentage of CI runs failed due to this test case. |
| PRs Impacted | The number of PRs that have been affected by this test case failing in CI. |
| Last Run | The most recent timestamp for an upload test run. |
Test Deletion & History
- Inactive tests disappear from the dashboard automatically after 30 days and are fully removed after 45 days. Tests cannot be manually deleted.
- Changing test identifiers (e.g., adding file paths) creates new test entries — merging with old history isn’t supported.
Test case details
You can click on any of the test cases listed on the Flaky Tests dashboard to access the test case’s details. The test details page uses a tabbed layout:- Summary: Run result charts and failure types grouped by unique failure reason.
- Test History: A searchable, paginated table of every individual test run with filtering and a detail panel.
- Monitors: Detection monitors configured for this test (visible when the detection engine is enabled).
- Events: A timeline of detection events, quarantine actions, ticketing events, and status transitions (Healthy, Flaky, Broken) for this test (visible when the detection engine is enabled). Use the category filter to scope to Flake Detection events to see which monitor triggered each transition.
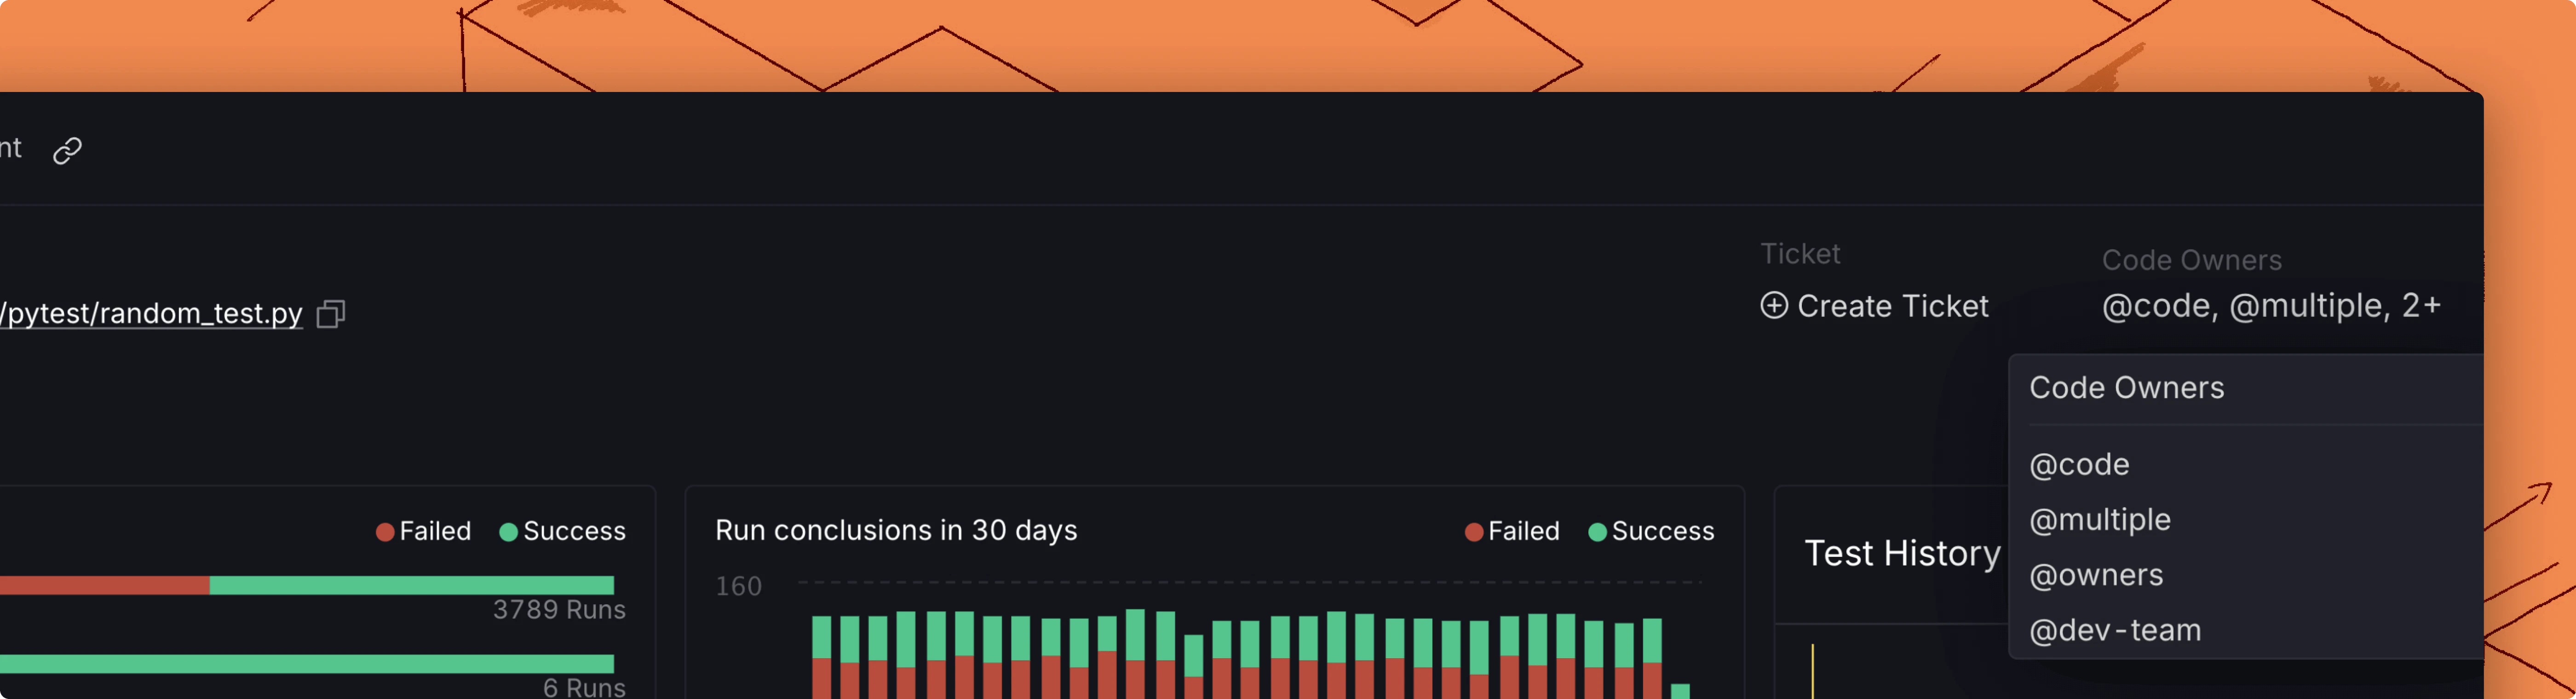
Code owners
If you have a codeowners file configured in your repos, you will see who owns each flaky test in the test details view. We support code owners for GitHub and GitLab repos.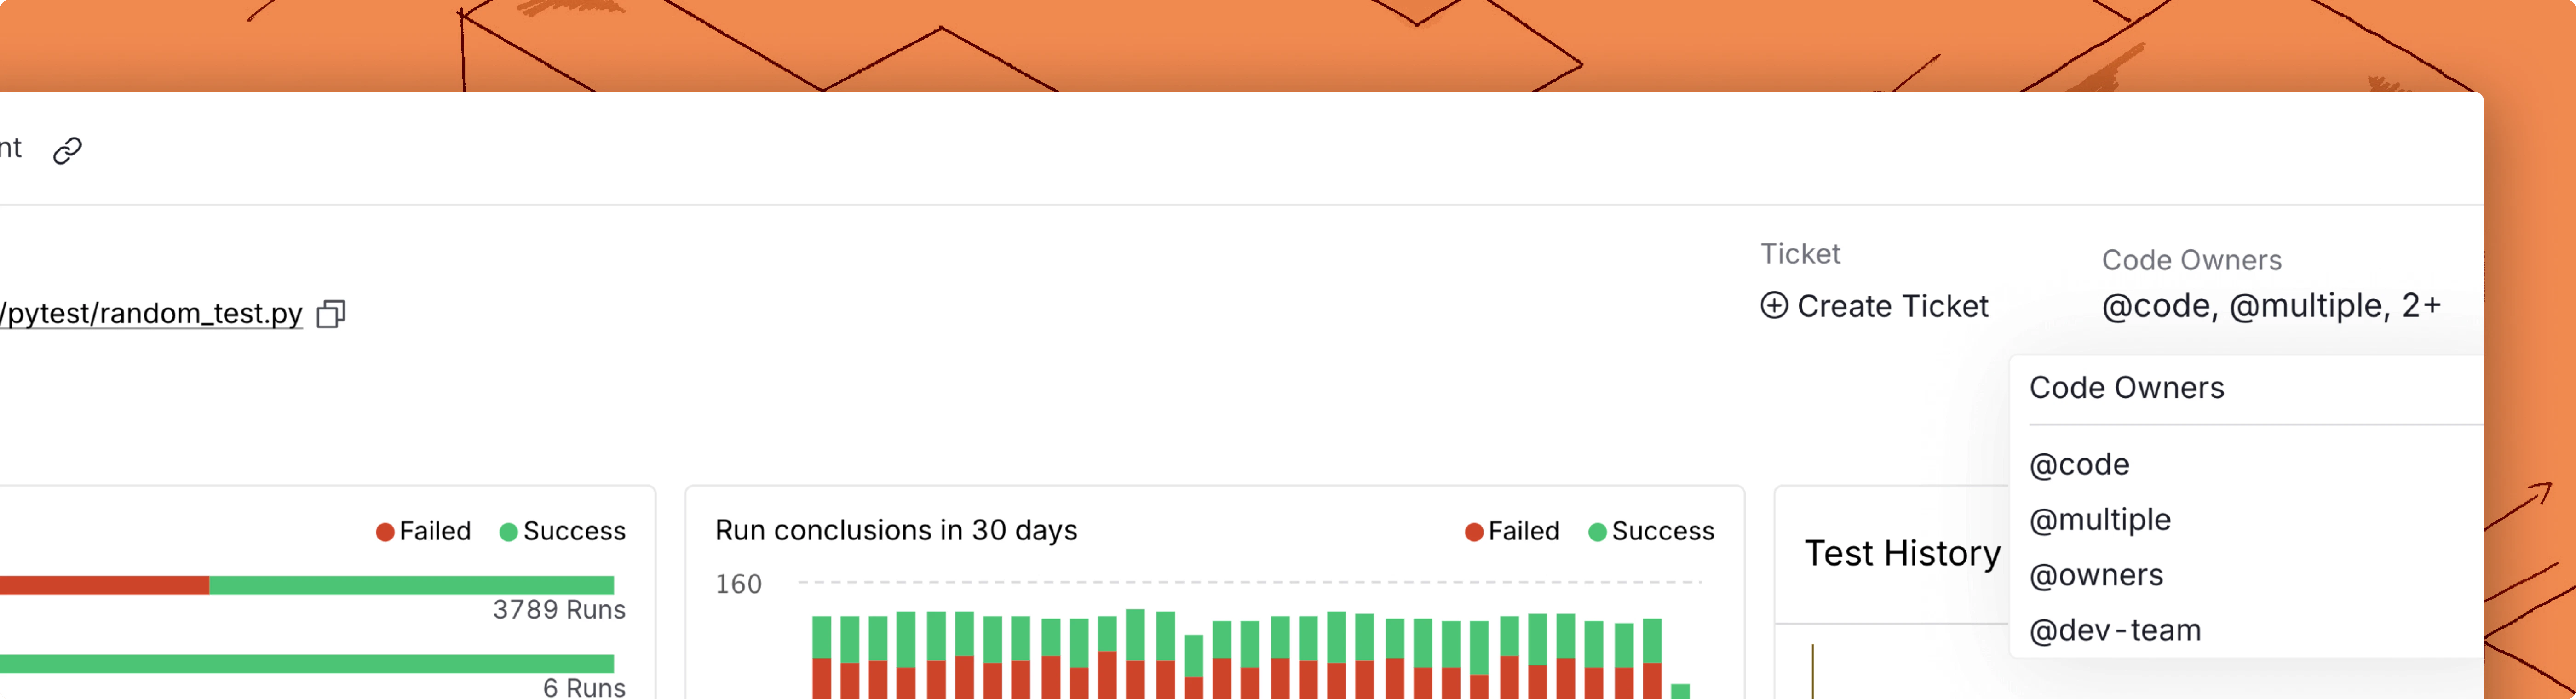
Summary tab
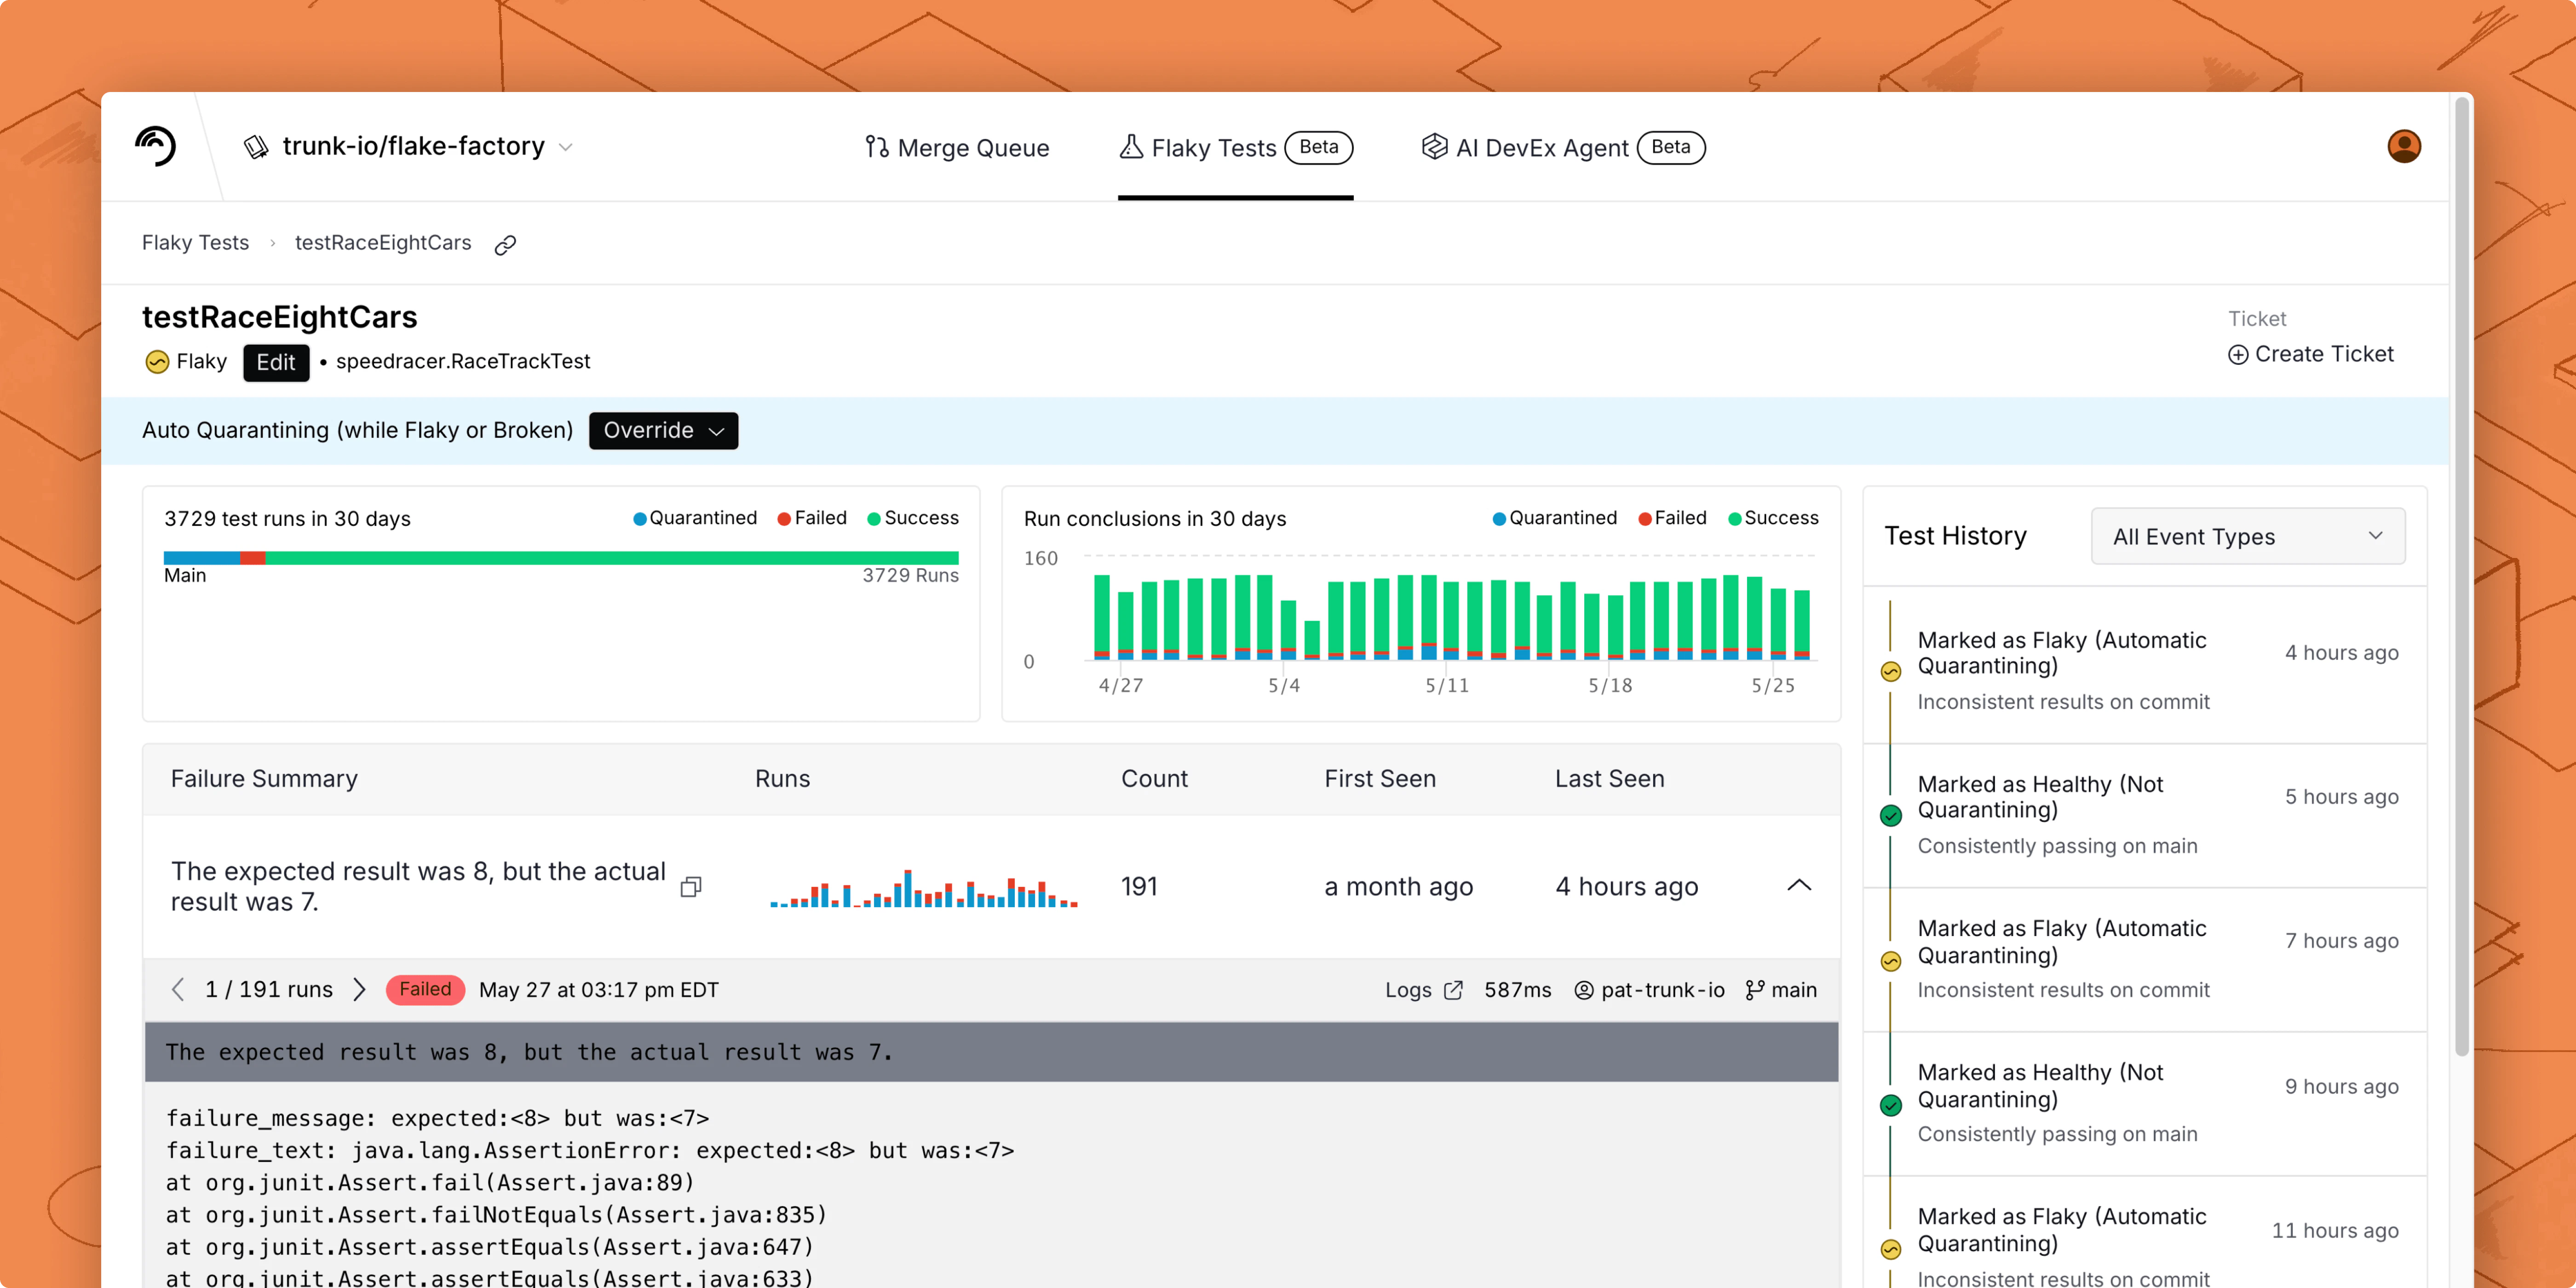
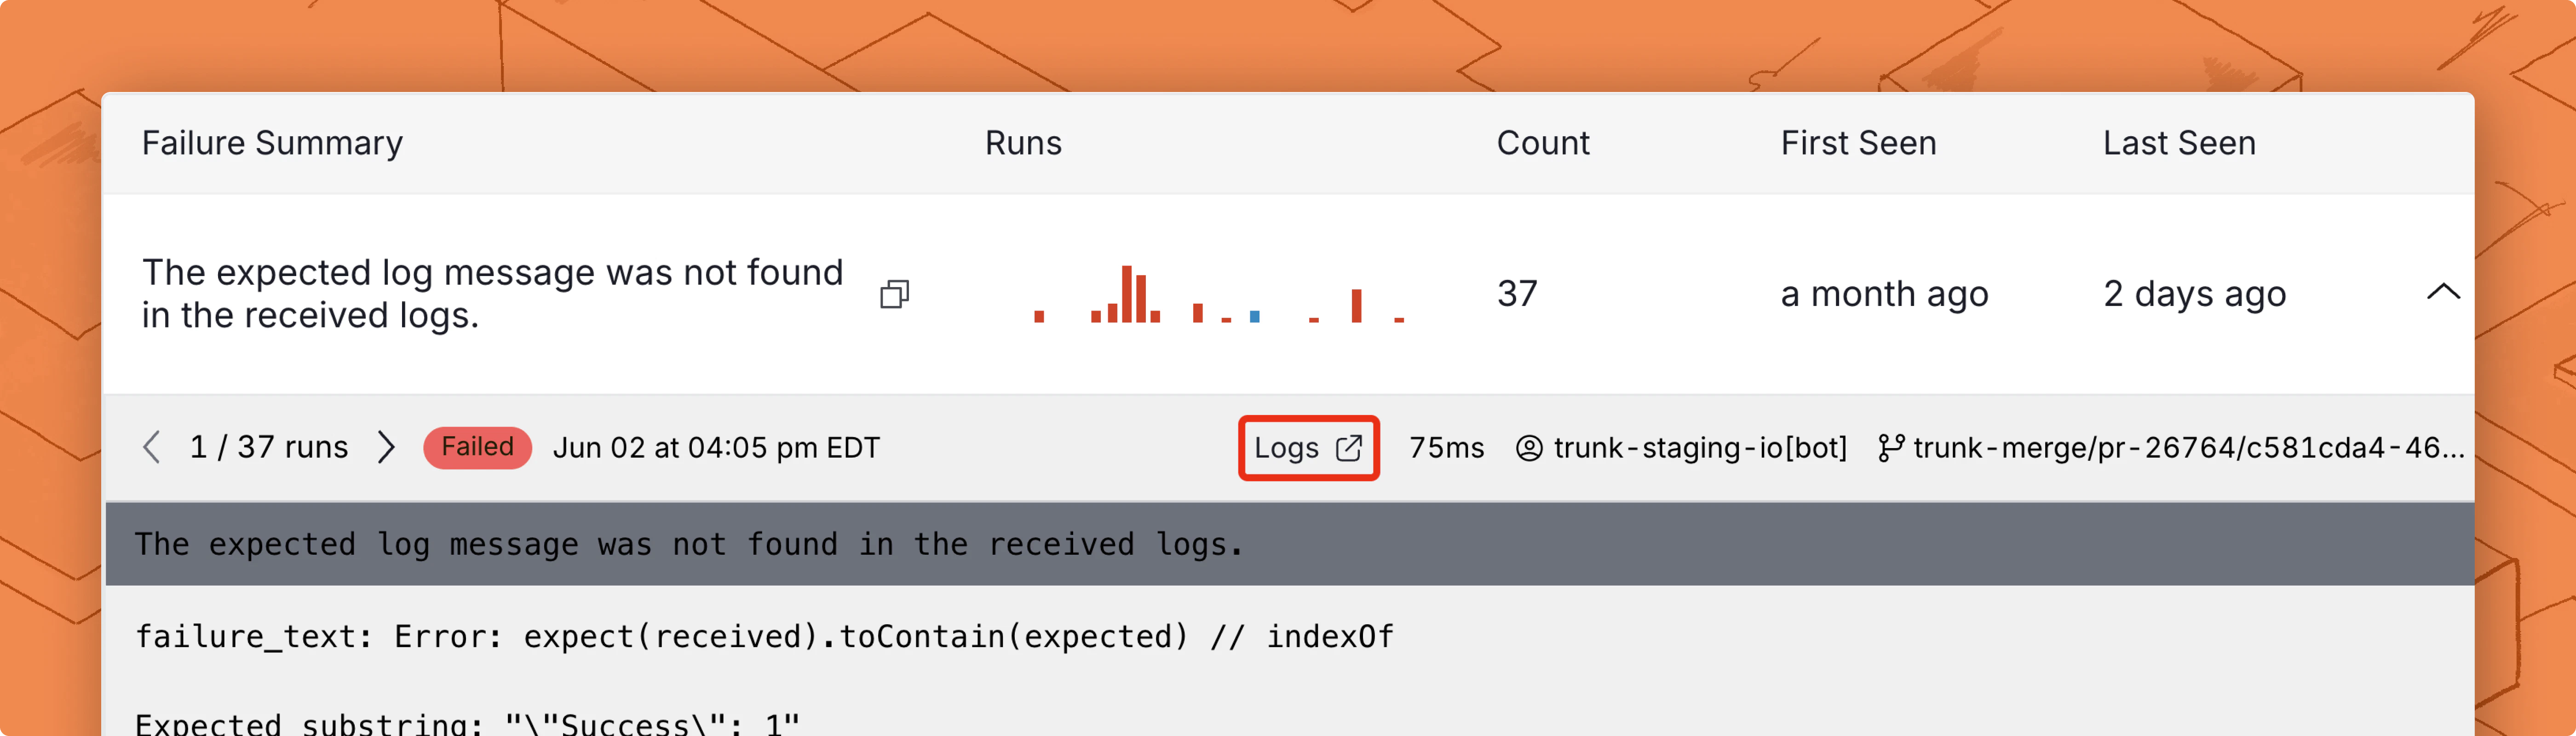
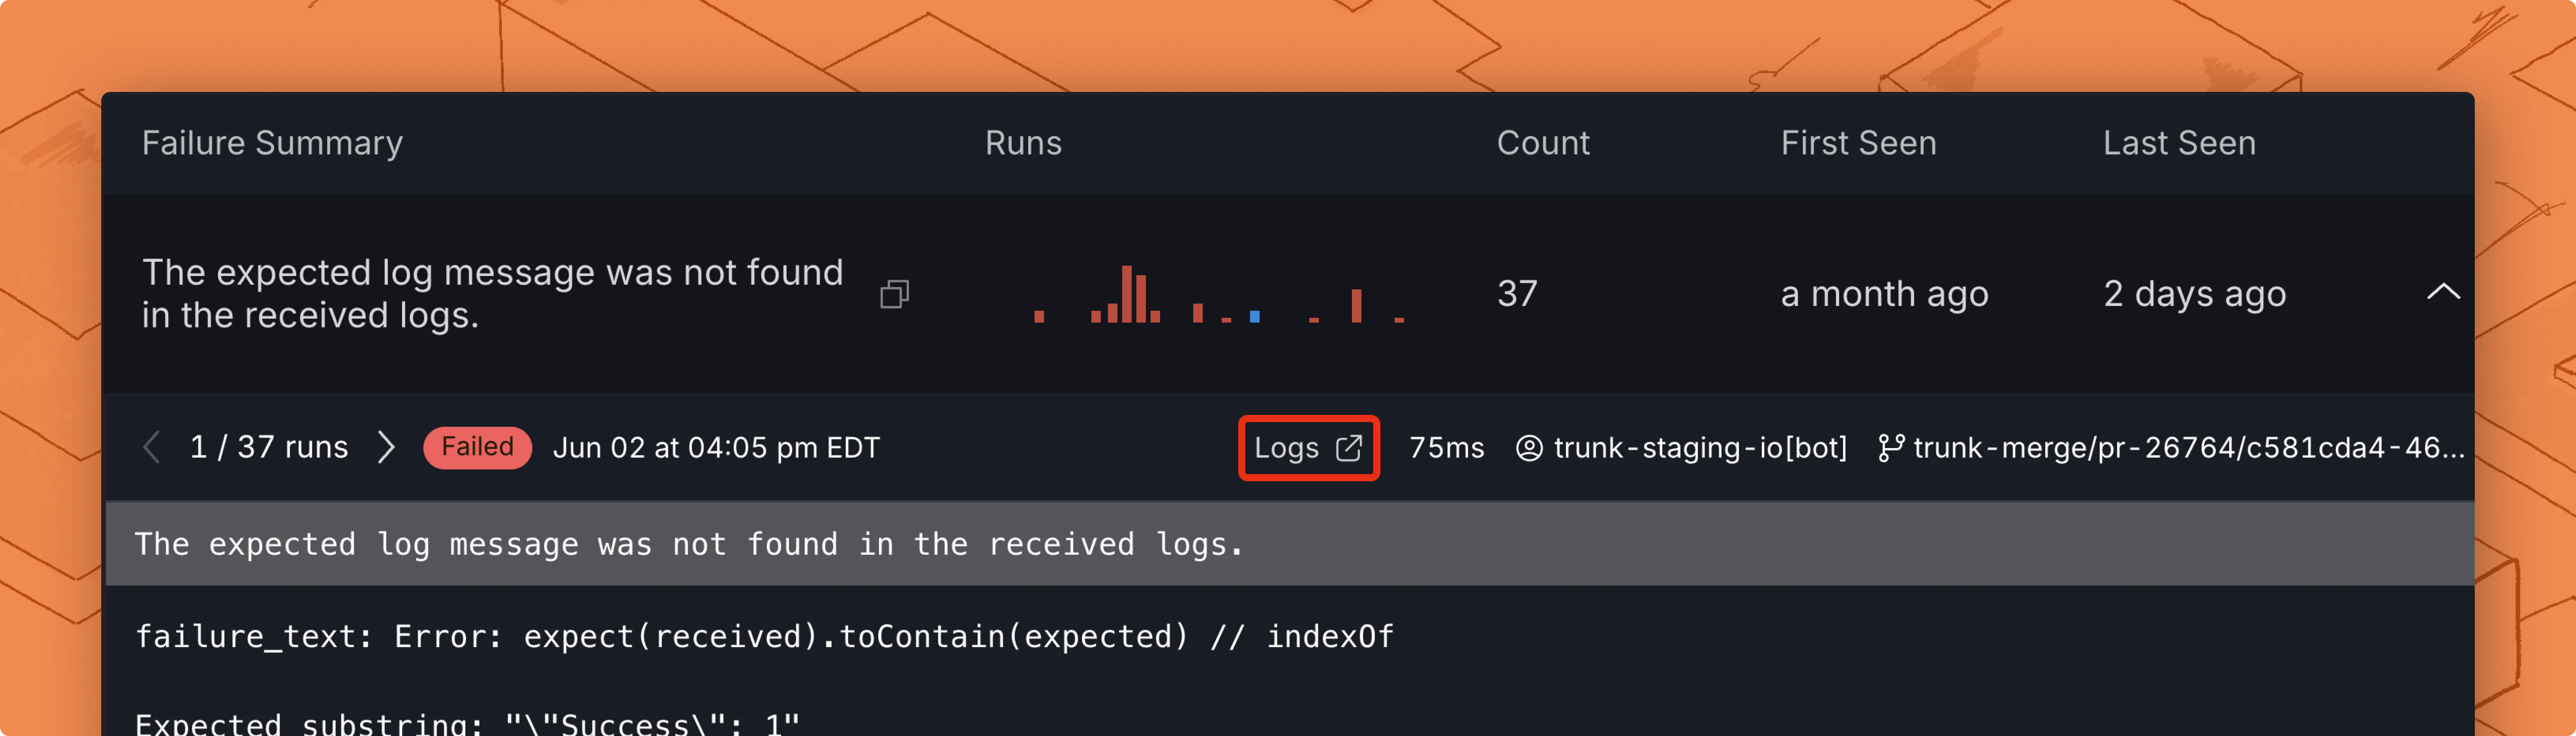
Failure types
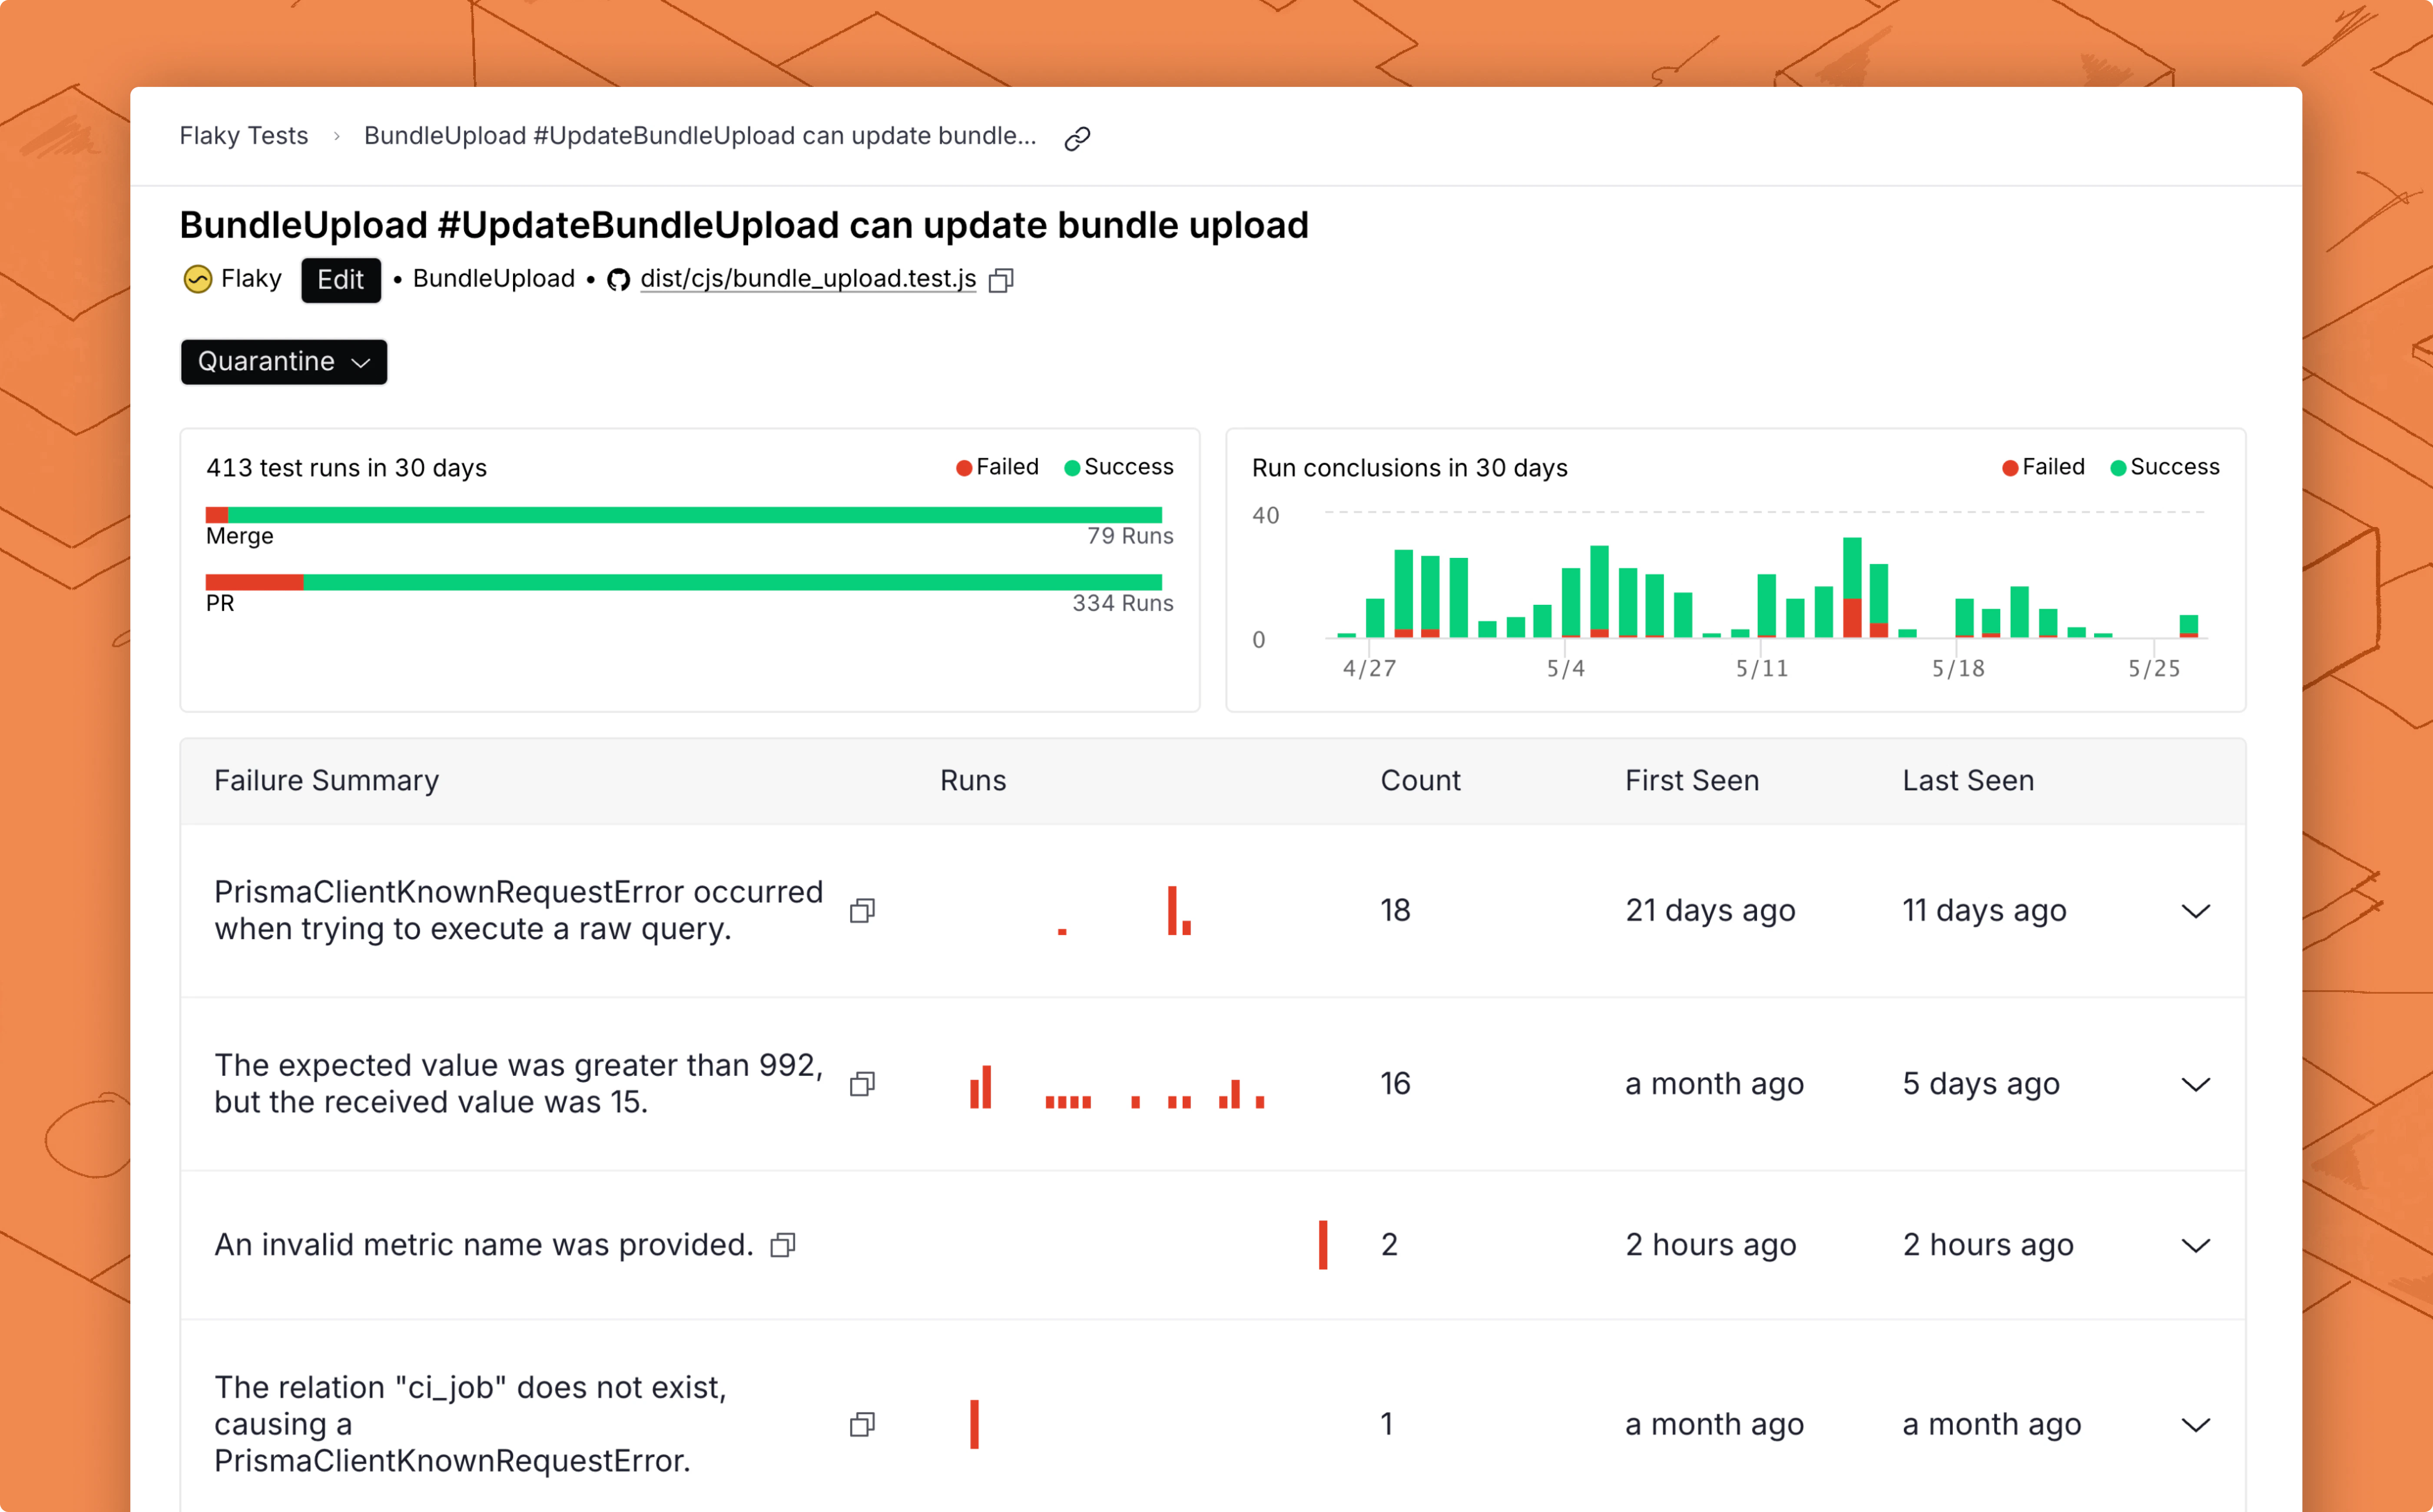
Failure details
You can click on any of these test runs to see the detailed stack trace: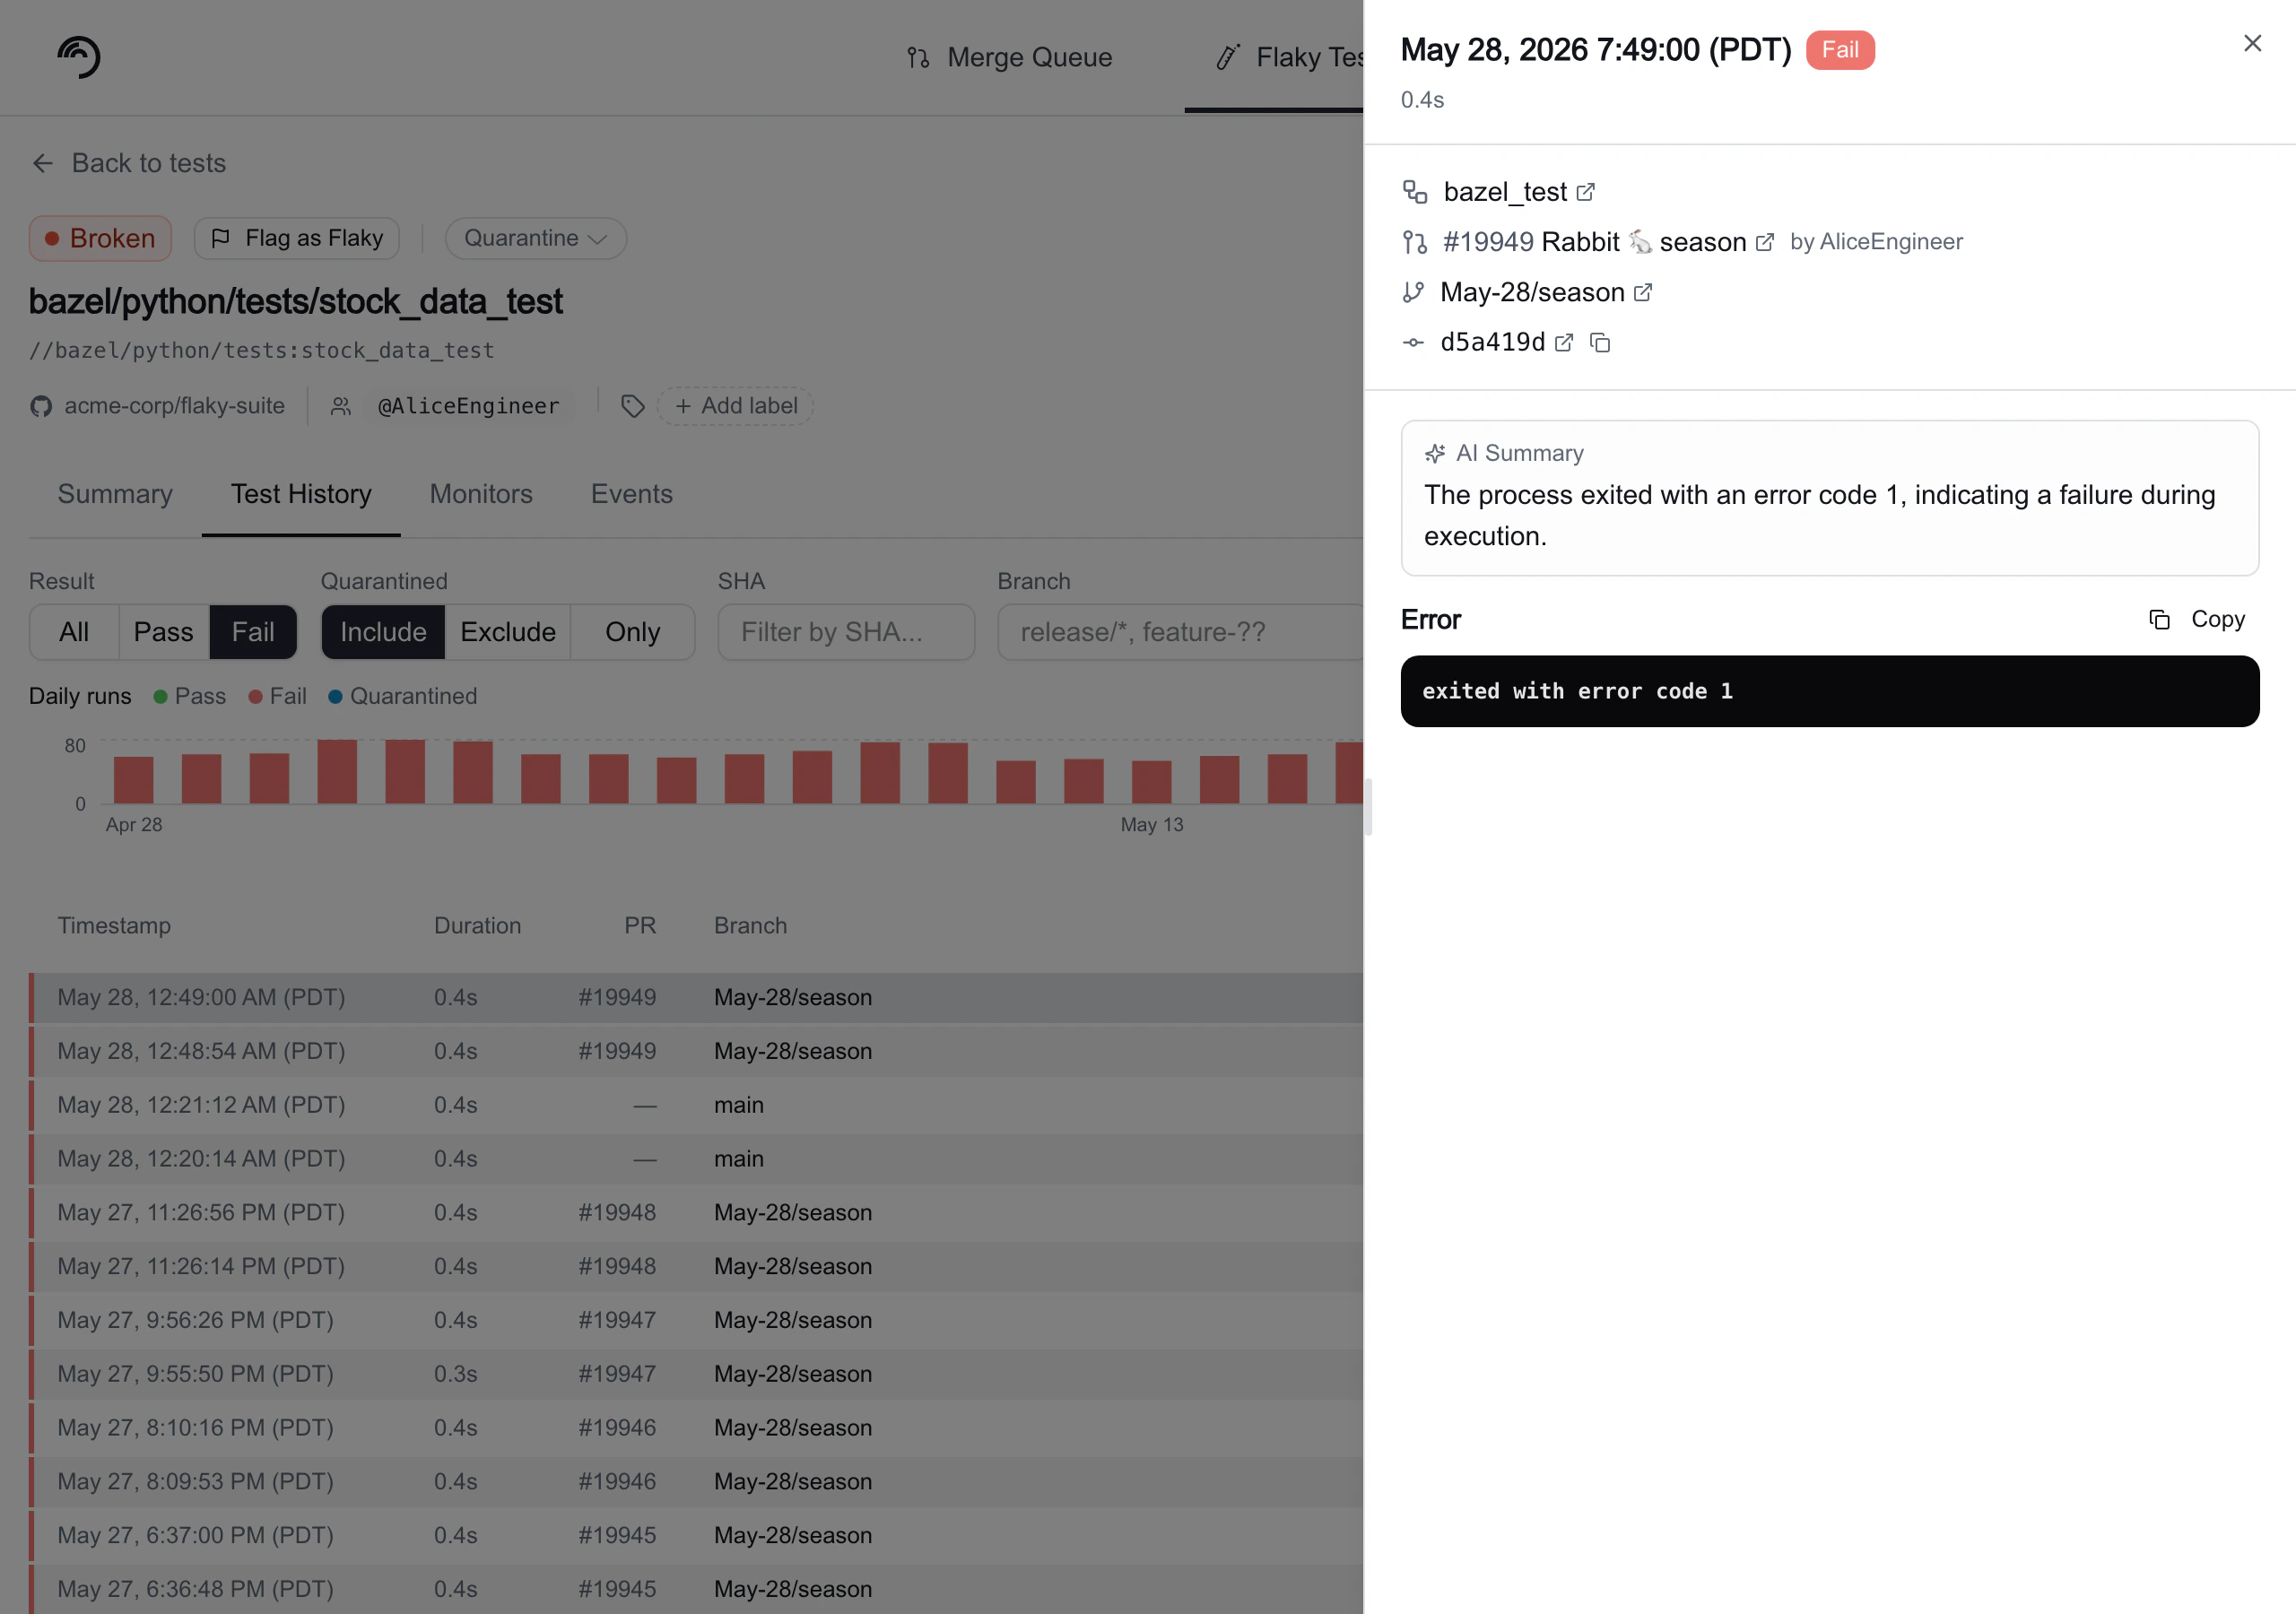
Test History tab
The Test History tab gives you full visibility into every individual run of a test. Use it to investigate patterns across branches, find specific failing runs, and drill into error details.Daily runs chart
A stacked bar chart at the top of the tab shows daily test run counts. The legend identifies four categories:- Green: Pass
- Red: Fail
- Blue: Quarantined
- Gray: Skipped
Filters
A filter bar below the chart provides four independent controls:| Filter | Description |
|---|---|
| Result | Segmented control with All, Pass, and Fail to scope the table to a specific outcome. |
| Quarantined | Segmented control with Include (default), Exclude, and Only to control whether quarantined runs are mixed in, hidden, or shown exclusively. |
| SHA | Filter by commit hash. Matches runs whose SHA starts with the entered text. |
| Branch | Filter by branch name. Accepts exact names or glob patterns. Use * to match any sequence of characters and ? to match a single character. |
| Pattern | Matches |
|---|---|
main | The branch named main exactly |
release/* | All release branches, e.g. release/1.0, release/2.3 |
feature-?? | Feature branches with a two-character suffix, e.g. feature-v2 |
trunk-merge/* | All merge queue branches |
result=pass or result=fail. The Quarantined filter accepts quarantined=include, quarantined=exclude, or quarantined=only.
Runs table
The runs table displays a paginated list of individual test runs (25 per page) with the following columns:| Column | Description |
|---|---|
| Timestamp | When the test ran, displayed in your local time zone. |
| Duration | How long the test took to execute. |
| PR | The pull request number associated with the run, e.g. #1234. Empty for runs that aren’t tied to a PR. |
| Branch | The branch the test ran against, e.g. main, feature/x, or trunk-merge/pr-1234/... for merge queue branches. |
| Commit | The first 7 characters of the commit SHA. |
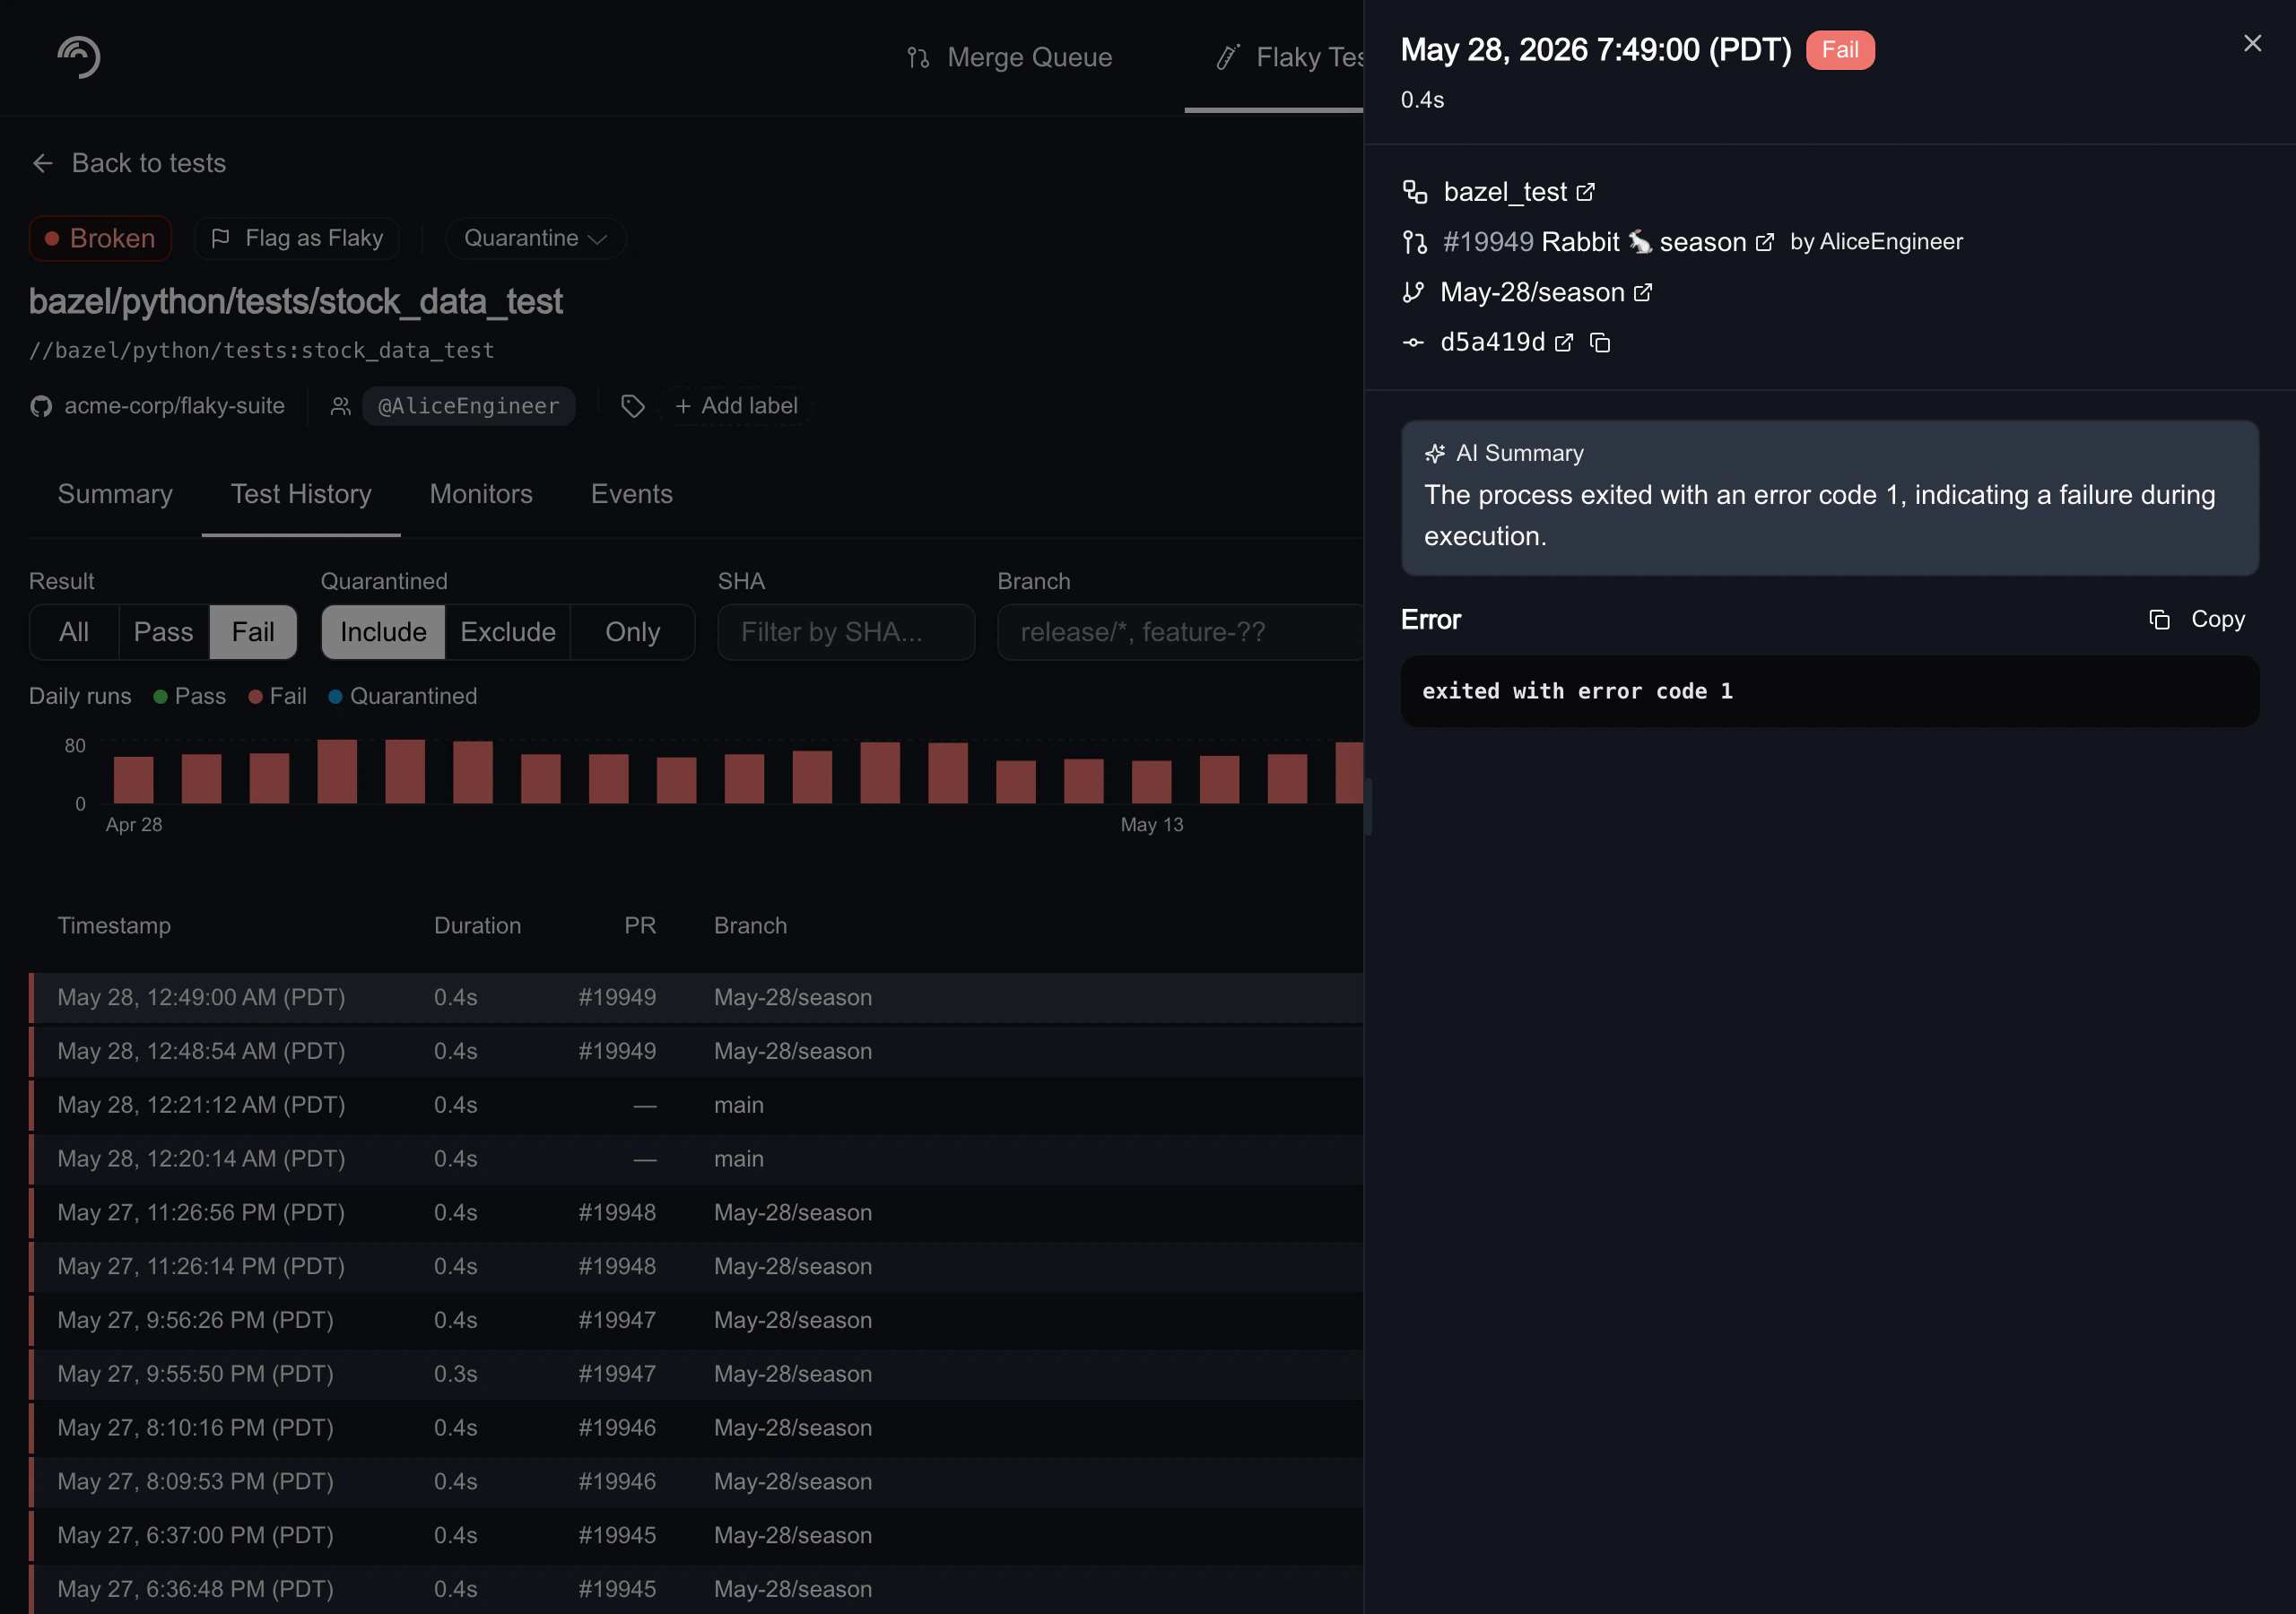
Run detail panel
Click any row in the runs table to open a detail panel on the right side of the page. The panel shows:- Run header: Timestamp, a result badge (Pass, Fail, Error, or Quarantined), and run duration.
- Source control: A CI job link (with the provider’s icon, the job name, and the CI duration), the linked pull request, branch, and commit. Merge queue runs also include a View in Merge Queue link.
- Error details: For failed, errored, or quarantined runs, an optional AI summary of the failure followed by the raw error text or stack trace.